
Demand Analysis of Crop Insurance
Sep.2016-Aug.2017
corn insurance purchase in the Midwest area and regression results


Cleaned and analyze data on 20 years of insurance, yield and planted acres of corn in RMA-USDA and NASS-USDA with STATA
Visualized the corn insurance purchase in the Midwest area with ArcGIS software
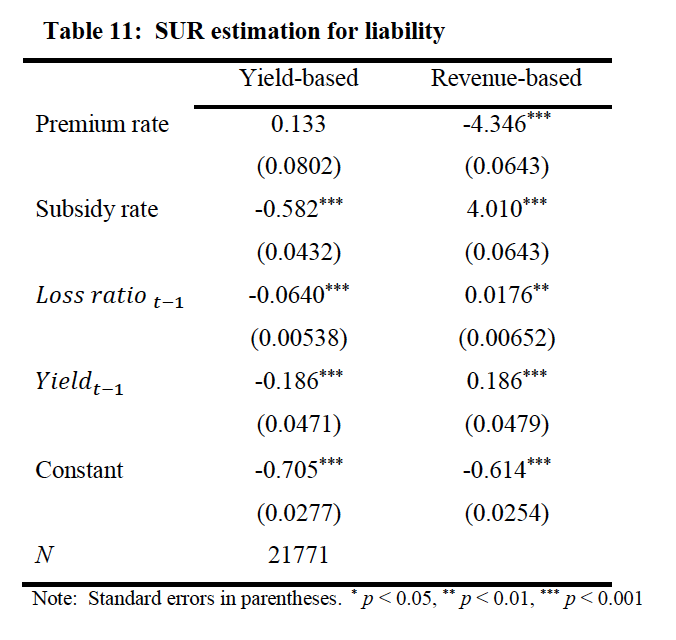
Developed FE and SUR regression model to determine the insurance demand elasticities regarding loss-risk, premium, subsidy, yield
Analyzed the results in the thesis: “An Empirical Analysis of Crop Insurance demand: Evidence from Corn Insurance in the Midwest”